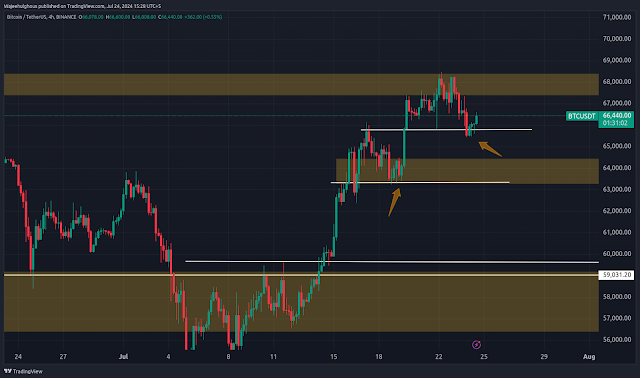
In our last blog, we predicted a rise to the level of 65.759[pic1] This area is important because BTC has very strong liquidity here, hence a classic "liquidity hunt" which was followed later on by violent sell-off. We had a blast with the profits from that one-- hope you did too.
BTC/USD: BTC Playing Out Uptrend We will probably see the retest of 68.389 if this candle gets closed on a positive note. This level is so important because it would be a resistance point that market may face selling pressure.
If this happens right before New York comes in, then there's a good chance that during the NY session we will pull back to half-way of that bullish candle. This pullback is typical as the market searches for liquidity to allow institutional players a chance to enter or exit positions. If the structure of the market changes to form a downward movement during today's New York session, it can run up onto 65.332 area. Breaking this level we can sell the market pressure 63,322. check the chart 1H
What we feel is that a pull-back of the market to half bullish candle during NY session might take it up. We base this expectation on the way markets moves, they liquify. A close in perspective for BTC/USD on this candle but a retracement follows, it means that the market is preparing to make one more upward move.
When trading these moves, it is important to treat the trade executions at shorter time frames from 1-minute up to a maximum of 15-minutes charts. It also enable you to make more specific entries and exits, effectively taking the smaller movements inside of a larger trend.
I personally dependent on 15-minute chart of market and look the momentum shift clearly form out then order block, that is my typical sign to think about trade. If a FVG is created during this period, it could be signalling an important support/resistance level. But if you are trading with the signals aligned this may increase your winning odds.
To sum up, BTC/USD is very bullish and it should make further upside if we won't see any red bar on a relevant time frame. Technical Analysis Levels to Watch The important levels of 68,389 on the upside and 65,332 on the downside A key price action trading volume chokepoint and if the New York session pullbacks to mid of a massive bull candle then the market is likely burdening north. Short term traders can time their buy and sell signals to better match the current market conditions using smaller charts while watching longer haul trend lines for key levels.
As with anything, always be vigilant and adjust your overarching strategy according the current market environment combined with liquidity zones/ momentum shifts. Practising such steps will assist you to explore the market beautifully and feature tremendous trading opportunities.


0 Comments